Intelligent Dynamic and Static Signage Management Solution
1. Industry pain points
As commercial complexes, transport hubs, industrial parks and cultural-tourism venues expand, their internal spaces become more complex.
Signage is the link between people and space and directly affects circulation efficiency, safety guidance and public experience. Traditional signage management is no longer adequate in four areas.
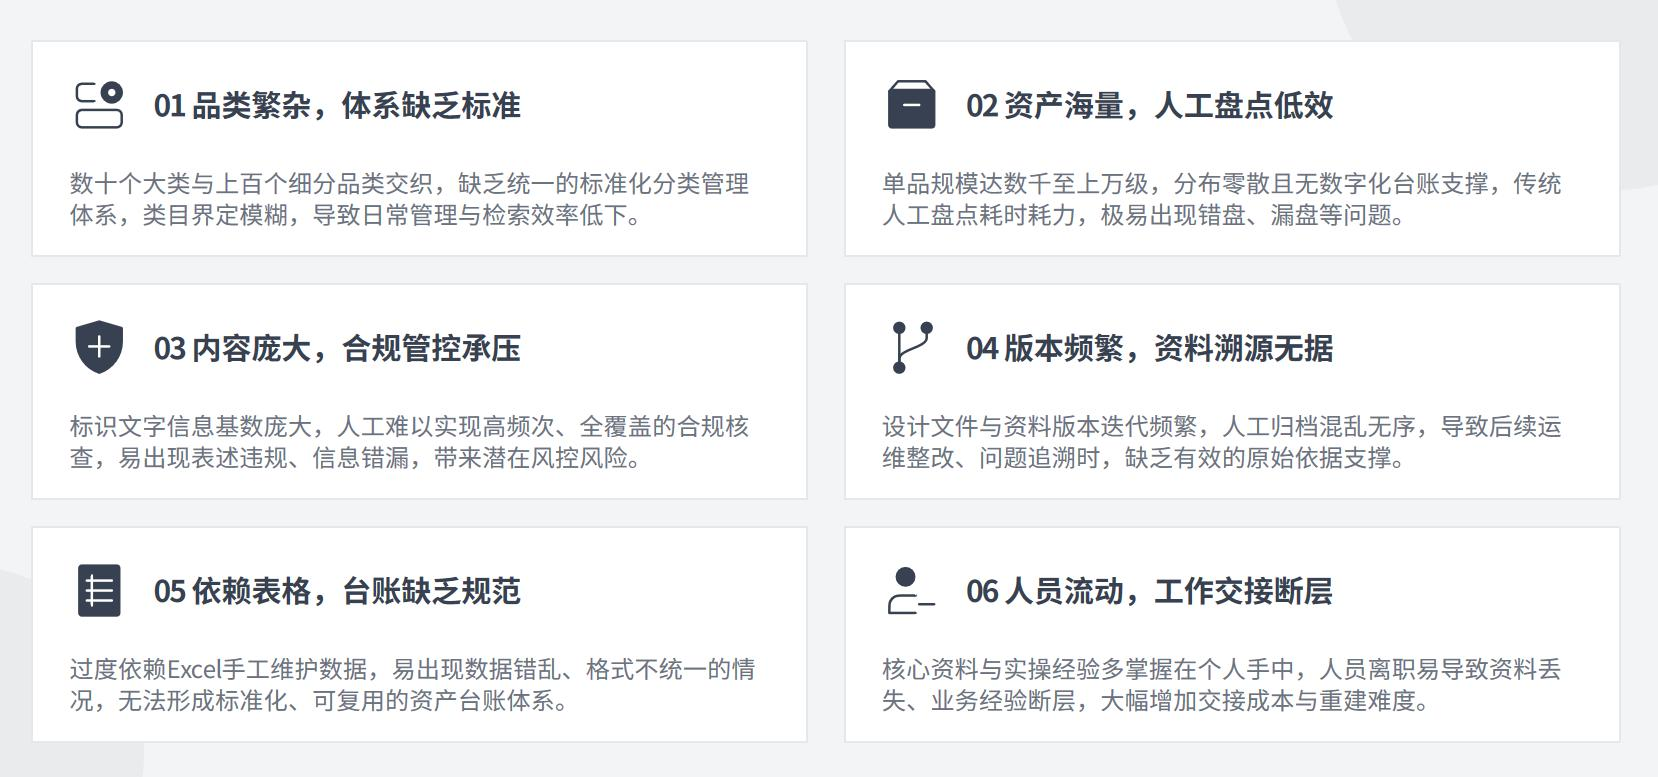
Pain point 1: Disordered assets and no reliable inventory
A large venue may contain dozens of signage categories: directional signs, directory signs, warning signs, service signs, advertising locations, LED information displays and smart light boxes.
Thousands or tens of thousands of individual assets may be distributed across floors, areas, underground garages and outdoor plazas.
Traditional management relies on manual Excel records. Categories are inconsistent, naming is arbitrary and installation locations are described only in words.
Inventory checks require people to carry spreadsheets around the entire venue for weeks, and the results still contain omissions. Managers cannot accurately answer the basic questions
“how many assets are there, where are they and what is their status?”
Pain point 2: Maintenance depends on memory
Who inspected which device, what was missed and which maintenance task is overdue all depend on memory or simple paper records. There is no systematic inspection plan,
task-assignment mechanism, standard work checklist or online acceptance loop. Long-term maintenance records and fault databases are also missing.
Repeated faults are handled differently by different people with no traceable record, so the same problems recur, maintenance efficiency declines and equipment life becomes shorter.
Pain point 3: Scattered documents and broken knowledge transfer
Signage projects generate drawings, contracts, construction records and rectification documents from planning and design through installation,
daily maintenance and upgrades. In traditional workflows these files are scattered across employees' computers, chat groups and paper cabinets.
When a key employee leaves or changes roles, much of the information disappears. New staff start almost from zero, and project history,
decision background and asset changes cannot be traced. Every handover creates a new information gap and increases management cost.
Pain point 4: Separate management of dynamic and static signage
Static signs and dynamic signs such as LED information displays, smart light boxes and video publishing terminals are managed separately.
Static assets are inspected manually, while dynamic assets use a separate content-publishing system. Data and workflows do not connect.
When holiday activities or emergencies require changes to guidance information, staff must visit each static sign and operate each dynamic screen separately.
Managers cannot see the complete operating picture from one platform.
2. Solution
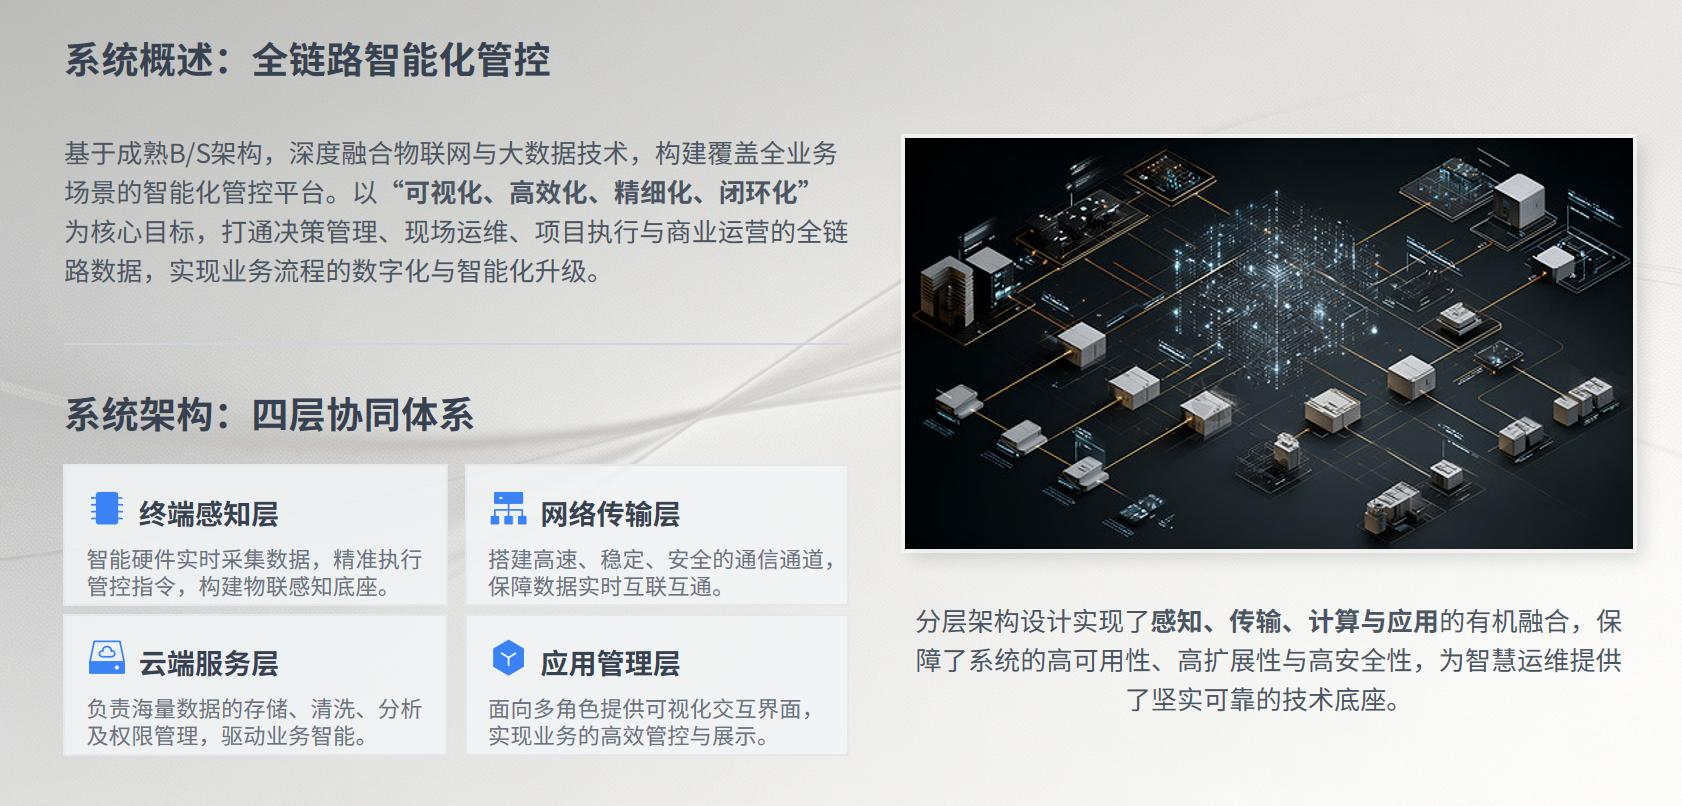
Ruanjie provides an integrated cloud platform for dynamic and static signage management. It brings both asset types into one system and covers asset registration,
maintenance work orders, content publishing and data analysis across the full lifecycle.
The system uses a browser/server architecture. The PC back end provides global control and analysis, while a mobile mini program supports front-line work.
Data is synchronised in real time to create a complete loop: tasks are assigned in the back end, staff complete them on a phone, and managers review the results online.
Capability 1: Digital asset registration across the entire site**
Create a standard multi-dimensional classification system by function (directional, directory, warning, service and commercial), equipment type and installation scenario.
Generate a unique code and digital file for every signage asset, recording parameters, materials, installation position, construction drawings, acceptance photos and all maintenance history.
Result: Inventory changes from “people running around for weeks” to “one-click export from the platform.” Any asset opens its full lifecycle file, and a QR scan identifies its location.
Excel batch import and export support initialisation of thousands of assets in one day.
Capability 2: Online closed loop for the full maintenance process
The work-order system covers fault repair, routine inspections, scheduled maintenance, content rectification and equipment repair. Plans can be configured by equipment type and scenario,
including frequency, content, responsible person and deadline. Tasks are generated automatically and reminders are pushed when due. Field staff receive tasks through the mini program,
follow the standard checklist, upload photos and submit online. Managers accept remotely; failed work can be rejected for rework and the complete history remains traceable. Owners,
internal maintenance teams and third-party suppliers can work on one platform with separated permissions.
Result: Verbal assignments and paper records become system assignment -> field execution -> photo evidence -> online acceptance -> searchable archive.
Responsibilities are clear and every action can be reviewed.
Capability 3: 3D and GIS spatial visual control
Place every signage asset accurately on a 3D/GIS map. Distribution, deployment density and operating status are visible on the map. Managers can see which areas have insufficient signage,
which points are redundant and which assets are faulty without opening spreadsheets or visiting the site. Clicking an icon opens the asset file and maintenance history.
Result: Finding an asset changes from searching drawings and asking experienced staff to a map click or QR scan with second-level positioning.
New staff can understand the site layout without one-to-one handover training.
Capability 4: Remote real-time control of dynamic content
Connect the platform to dynamic screens and smart light boxes. Images, posters and short videos are edited and uploaded centrally, then pushed to selected devices.
The system supports immediate publishing, scheduled publishing and time-based rotation, such as automatic weekday, holiday and peak-period content.
Content review and an asset library provide compliance control, publishing history and update reminders.
Result: Holiday guidance, temporary route changes and emergency notices are published in batches from the back end and take effect within seconds, e
liminating low-efficiency device-by-device updates.
Capability 5: Data-driven intelligent analysis
The system aggregates maintenance data and presents equipment count and online rate, fault-rate trends and hot spots, inspection completion and maintenance progress,
average work-order handling time, staff workload and supplier performance.
Managers can see efficiency trends, identify recurring faults and adjust inspection frequency and maintenance strategy.
The platform changes management from experience-based judgement to measurable trends and data-backed decisions.
3. Differentiated advantages
| Dimension | Traditional management | Intelligent signage platform |
|---|
| Scope | Static and dynamic assets managed separately | One platform controls all signage assets |
| Asset management | Manual Excel records with inconsistent categories and omissions | Standardised digital records, one code per asset and second-level search |
| Spatial control | Paper drawings and staff memory | 3D/GIS visual map with click-to-query |
| Maintenance | Passive response and verbal assignments with no record | Planned inspections, automatic reminders, closed-loop work orders and full traceability |
| Content updates | Each dynamic device updated on site | Remote batch publishing, scheduled rotation and one-click release |
| Knowledge transfer | Information stays with individuals | Full lifecycle records remain in the platform |
| Decisions | Subjective experience | Visual indicators, trend analysis and AI-supported recommendations |
Four core differentiators:
Dynamic and static integration: Both asset types are managed in one platform, breaking data silos.
Spatial visibility: 3D/GIS vector maps provide a “what you see is what you manage” experience.
Full-chain traceability: Planning, changes, maintenance and retirement all leave records that can be traced back.
AI assistance: Intelligent analysis supports fault-trend prediction and maintenance-strategy recommendations, moving from “people find problems” to “the system anticipates problems.”
4. Before and after implementation
| Scenario | Before | After |
|---|
| Asset inventory | Staff carry spreadsheets around for weeks; results remain inaccurate | One-click export with real-time accurate data; inventory efficiency improves by more than 80% |
| Asset location | Search drawings, ask experienced staff and visit the site; often more than 15 minutes | Map click or QR scan locates the asset in seconds |
| Inspections | Verbal arrangements and self-discipline; missed inspections are hard to detect | Automatic tasks, deadline reminders and overdue alerts make completion transparent |
| Fault repair | Find fault -> call -> describe verbally -> wait; response time varies | One-click mini-program report, automatic assignment and full tracking; response shortened by more than 60% |
| Content updates | Staff visit each device; one commercial complex may take half a day | Remote batch publishing completes a site-wide update in minutes |
| Staff handover | Several days of verbal explanation still leave gaps | Complete platform data lets new staff understand the asset inventory immediately |
| Maintenance review | No data support; decisions rely on memory | Automatic reports show fault distribution and trends |
| Management decisions | Managers focus on areas they feel have more problems | Dashboard shows the real trend and supports precise resource allocation |
| Supplier assessment | Subjective evaluations and verbal feedback | Work-order data quantifies completion, timeliness and rework |